Feeds:
Posts
Comments

Posts Tagged ‘flood’

On June 19th and 20th, northeast Minnesota and northwest Wisconsin were hit by a large rain storm that caused extensive flooding and property damage. This is the fourth and final post in a series where I explore geospatial technologies to integrate precipitation patterns, streamflow, imagery and reference data to better understand the impacts of the storm.

Google Earth and Keyhole Markup Language
Much of the data presented in the previous three posts are available in Keyhole Markup Language (KML). KML is named after Keyhole, Inc., developer of the Keyhole Earth Viewer, an early virtual globe. Keyhole was acquired by Google in 2004 and Google Earth evolved from the original Keyhole Earth Viewer. KML is now an open standard promoting data visualization and sharing. Google Earth has become the most popular virtual globe with over 1 billion downloads.

I used Google Earth to create an application that pulls together spatial data and animations to better understand the Duluth Solstice Storm and its impacts (click here to link to the file if you have Google Earth installed on your computer – it is a large file at 6.6 MB). Various data sources were grouped in four folders – precipitation, streamflow, imagery, and reference. The precipitation folder includes storm total precipitation for the 54 hour event and an animation of NEXRAD radar data that shows how precipitation moved over the Duluth region. The streamflow folder contains gages in the U.S Geological Survey’s National Water Information System. Clicking on individual points allows more exploration of the flow response of area streams to the storm. The imagery folder contains five MODIS images over two weeks of the sediment plumes reaching into the western arm of Lake Superior. The reference folder contains watershed boundaries for the St. Louis and Cloquet Rivers.

Together the data and animations in the four folders show how precipitation passed over the watersheds in the region, how the streams responded to the precipitation and how the receiving water body was impacted. This is a starting point for better understanding the storm. More data and animations could be added strengthen our understanding of flooding and water quality impacts.


Storm Total Precipitation and Watersheds in Google Earth


Stream Gages and Sediment Plumes in Google Earth

CUAHSI Hydrologic Information System
CUAHSI is an acronym for Consortium of Universities for the Advancement of Hydrologic Science. The Hydrologic Information System (HIS) component aims to improve accessibility and integration of the nation’s water information and develop tools to better understand hydrologic systems. Hydro Desktop is a software client for desktop computers that allows discovery and analysis of hydrologic data from the CUAHSI-HIS. Hydro Desktop allows a more technical understanding of the Duluth Solstice Storm. This movie shows Hydro Desktop in action for a site in Texas. The images below show storm total precipitation from the Solstice storm in relation to the St. Louis River watershed and streamflow on the Nemadji River near Superior, Wisconsin using Hydro Desktop.
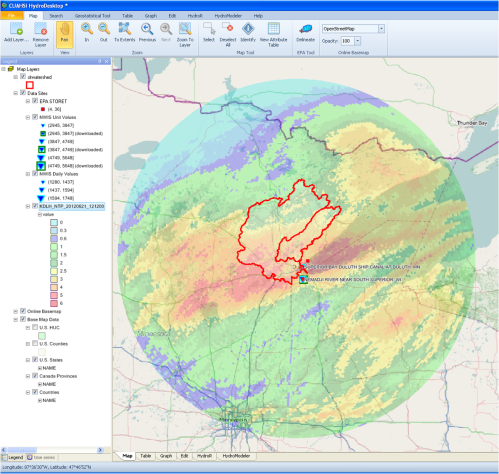

Storm Total Precipitation and the St. Louis River Watershed in CUAHSI Hydro Desktop


Nemadji River Hydrograph in the CUAHSI Hydro Desktop

Enhancing the Hydrologic Dashboard
As part of the Wisconsin Coastal Atlas project funded by UW Sea Grant, Erin Hamilton, a Masters student in Cartography and GIS at UW-Madison is enhancing the Fox-Wolf Hydrologic Dashboard using open-source JavaScript libraries such as OpenLayers for interactive mapping and HighCharts for graphing. The original dashboard was created with Adobe Flash to integrate and visualize distributed web services to support water resource management. It included the following components: (1) a map frame that includes stream gages and precipitation observations, catchment areas for stream gages, watershed boundaries and land cover; (2) time-series graphs of stream flow and precipitation data from the National Water Information System (NWIS) maintained by the U.S. Geological Survey; and, (3) a linkage between the stream flow graph and the map window that allows a user to view precipitation patterns from individual storm events in the context of gage location and catchment area and view animations of NEXRAD base reflectivity for precipitation events.
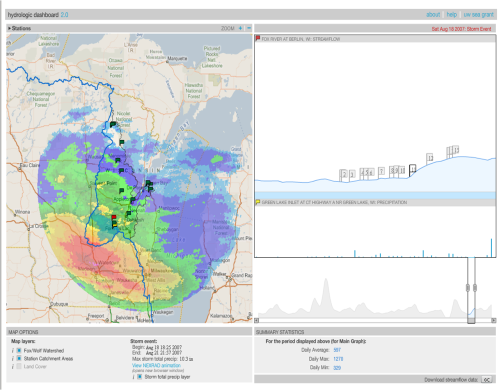

Fox Wolf Hydrologic Dashboard – Version 1

The enhanced version of the dashboard will more effectively link visualization of precipitation events, stream monitoring data, and changing land cover patterns in the watershed to satellite imagery and point observations of receiving waters to illustrate the impacts of human activities on land to coastal waters and provide the dynamic information needed to promote adaptive management of water resources. The overall concept of the enhanced dashboard was presented this March at the American Water Resources Association 2012 GIS Specialty meeting in New Orleans and Erin will present in October on the benefits of using open Javascript libraries at the North American Cartographic Information Society 2012 meeting in Portland, Oregon. A measure of success of the enhanced Fox-Wolf Hydrologic Dashboard is how transferable it is to watersheds like that of the St. Louis River.

Read Full Post »

On June 19th and 20th, northeast Minnesota and northwest Wisconsin were hit by large rain storm that caused extensive flooding and property damage. This is the third post in a series where I explore geospatial data and photos to visualize sediment plumes and flooding associated with the storm.

Sediment Plumes, MODIS Today – Space Science Engineering Center, University of Wisconsin-Madison
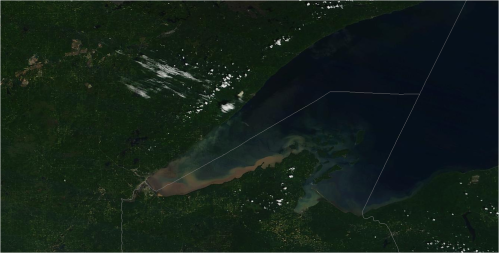
The best tool to view sediment plumes resulting from the Solstice flood extending into the western arm of Lake Superior is MODIS Today developed by the Space Science Engineering Center at the University of Wisconsin-Madison. MODIS Today shows Terra and Aqua products on a daily basis in true and false color at 2,000, 1,000 and 250 meter resolutions. You can view images in Google Earth and download images in standalone jpg format or GIS ready bundled with metadata, world (jgw) and projection (prj) files. Links provide the times for Terra and Aqua passes. A drop-down menu allows quick navigation to MODIS images for the past five years.

Below are Terra and Aqua images for the day after the storm.
Sediment in western Lake Superior – Terra – June 21, 2012 (pass approx 16:51 UTC -5 to CDT = 11:51am)


http://ge.ssec.wisc.edu/modis-today/index.php?satellite=t1&product=true_color&date=2012_06_21_173&overlay_sector=false&overlay_state=true&overlay_coastline=true&sector=USA3&resolution=250m

Sediment in western Lake Superior – Aqua – June 21, 2012 (pass approx 18:35 UTC -5 to CDT = 1:35pm)


http://ge.ssec.wisc.edu/modis-today/index.php?satellite=a1&product=true_color&date=2012_06_21_173&overlay_sector=false&overlay_state=true&overlay_coastline=true&sector=USA3&resolution=250m

The sediment is evident nearly two full weeks after the storm
Sediment in western Lake Superior – Terra – July 1, 2012 (pass approx 17:28 UTC -5 to CDT = 12:18pm)

http://ge.ssec.wisc.edu/modis-today/index.php?satellite=t1&product=true_color&date=2012_07_01_183&overlay_sector=false&overlay_state=true&overlay_coastline=true&sector=USA3&resolution=250m

Photos – Flickr

Searching on “duluth flood” accesses user contributed photos and video of the solstice flood. The Advanced Search link allows filtering for full text or tags only; photos, video or both; and by date.

Photo Galleries

Duluth Tribune
Flood Photo Galleries
http://www.duluthnewstribune.com/event/photogallery/id/2241/
http://www.duluthnewstribune.com/event/photogallery/id/2242/
http://www.duluthnewstribune.com/event/photogallery/id/2243/
http://www.duluthnewstribune.com/event/photogallery/id/2244/
http://www.duluthnewstribune.com/event/photogallery/id/2245/
http://www.duluthnewstribune.com/event/photogallery/id/2246/
http://www.duluthnewstribune.com/event/photogallery/id/2247/
http://www.duluthnewstribune.com/event/photogallery/id/2249/
http://www.duluthnewstribune.com/event/photogallery/id/2252/
http://www.duluthnewstribune.com/event/photogallery/id/2253/

Superior Telegram
Flood Photo Galleries
http://www.superiortelegram.com/event/photogallery/id/927/
http://www.superiortelegram.com/event/photogallery/id/928/
http://www.superiortelegram.com/event/photogallery/id/929/

Minneapolis Star Tribune
http://www.startribune.com/local/159735785.html
http://www.startribune.com/galleries/159705585.html
http://www.startribune.com/galleries/159883875.html
http://www.startribune.com/galleries/160075415.html

Minnesota Public Radio
Photos: Duluth, northeast Minnesota awash
http://minnesota.publicradio.org/display/web/2012/06/20/disaster/duluth-flood-photos/
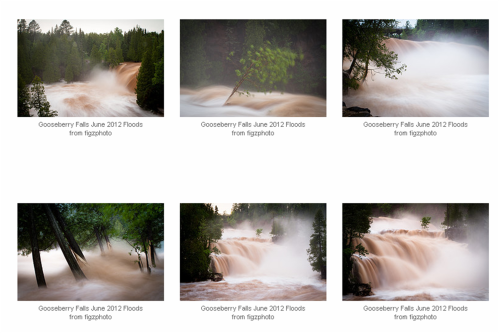
Photos: Gooseberry Falls at full trottle
http://minnesota.publicradio.org/display/web/2012/06/21/disaster/photos-gooseberry-river-in-full-roar-after-record-storm/
Photos: North Shore residents shocked by deluge
http://minnesota.publicradio.org/display/web/2012/06/21/disaster/duluth-flooding-photos/

Read Full Post »

On June 19th and 20th, northeast Minnesota and northwest Wisconsin were hit by large rain storm that caused extensive flooding and property damage. This is the second post in a series where I explore geospatial data and products to visualize precipitation patterns and flooding associated with the storm.

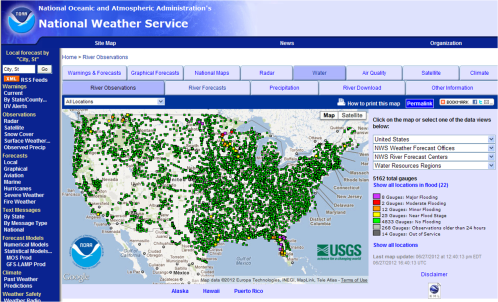
River Levels – Advanced Hydrologic Preduction Service, National Weather Service
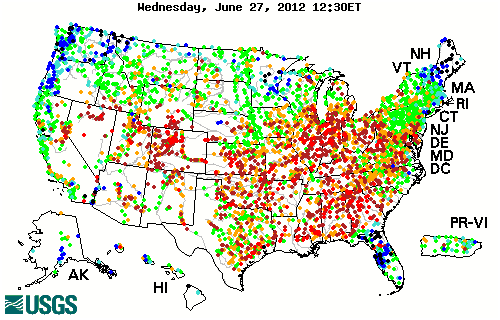
AHPS maintains a water tab on the National Weather Service website that includes river observations and forecasts. The image below shows river gage levels for over 5,000 locations across the U.S. for June 27, 2012. You can see the legacy of the Duluth Solstice storm, as well as Tropical Storm Debby in Florida.


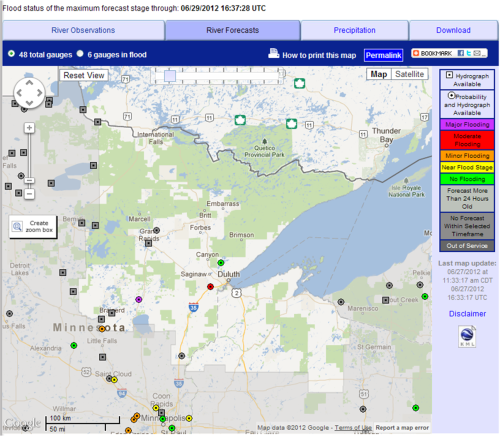
The following two images show river observations and the two-day forecast for June 27 covering the area served by the Duluth NWS office. Flood conditions remain on the St. Louis and upper Mississippi Rivers.

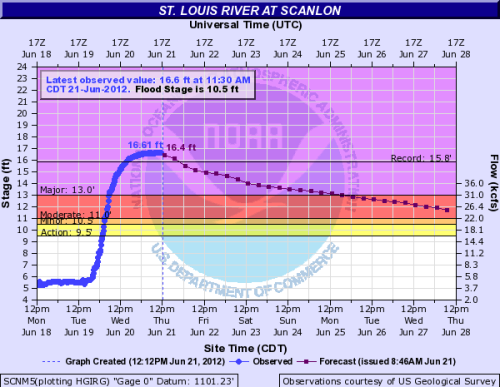
This links to the hydrograph for the gage on the St. Louis River at Scanlon, Minnesota. The first hydrograph image below for June 21 shows the rapid increase of over 11 feet in the river level in less than one day. The second image from June 27 shows the slow decline in river level from major to moderate flood stage.

National Water Information System – U.S. Geological Survey
The National Water Information System (NWIS) provides similar stream information as AHPS, but with more ability to explore observations for different time periods. The image below shows a national view of daily streamflow for June 27.

This link provides a custom query to show gage height, discharge, and precipitation for the station on the St. Louis River at Scanlon from June 14 to 27, 2012

Lake Superior Streams Data Viewer – Natural Resources Research Institute, University of Minnesota-Duluth
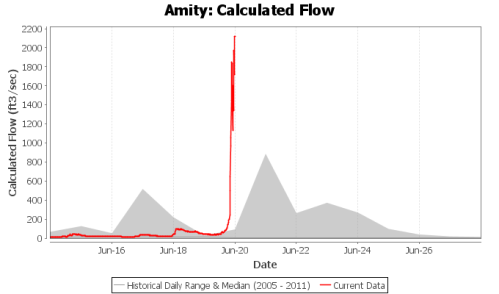
As part of the Lakes Superior Streams project to enhance public understanding of human impacts on aquatic ecosystems, NRRI developed interactive data visualization tools to animate and simplify the presentation of complex, real-time stream data. Sensors were placed in several Duluth trout streams. The Solstice flood destroyed these sensors, with the exception of one at the mouth of the estuary in the Duluth Shipping Canal. This story by Minnesota Public Radio describes what happened to the sensors, while the image of flow in Amity Creek below provides a graphical perspective.

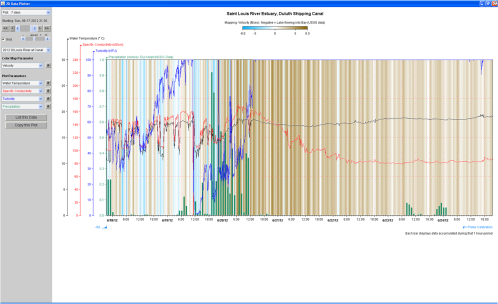
The data viewer for the Duluth Shipping Canal (http://www.lakesuperiorstreams.org/streams/data/Java/stLoRvr.html) shows water movement into and out of the St. Louis River Estuary. The 7-day plot below is centered on the storm event. The blue background shows water movement from Lake Superior into the estuary, while brown shows water movement out of the estuary and into the lake. Before the storm, the alternating shades of light blue and brown show the “seiche” effect of water movement between the lake and estuary. After the storm, the dark brown pattern shows more consistent high movement of water out of the estuary.

Read Full Post »

On June 19th and 20th, northeast Minnesota and northwest Wisconsin were hit by large rain storm that caused extensive flooding and property damage.  This post is the first in a series where I explore geospatial data and products to visualize precipitation patterns associated with the storm, as well as the resulting impacts.

NEXRAD Composites – Iowa Environmental Mesonet

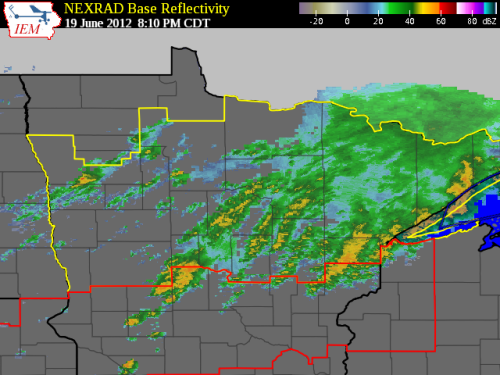
I find the Iowa Environmental Mesonet (IEM) a useful source of information to visualize precipitation events.  The Current and Historical IEM NEXRAD Composite Loop allows users to create an animated loop of NEXRAD base reflectivity with up to 100 frames with an interval as short as five minutes from an archive that dates back to 1995.

The first animation of the Duluth Solstice storm is at the scale of the continental United States with 100 frames at 60 minute intervals that runs from June 17, 2012 at 12:00 PM CDT to June 21, 2012 at 12:00 PM CDT.

The second animation is at the scale of the northern Minnesota with 100 frames at 10 minute intervals that runs from June 19, 2012 7:00 PM CDT to June 20, 2012 11:30 AM CDT.

Weather and Climate Toolkit – National Climatic Data Center
The National Climatic Data Center (NCDC) in Asheville, North Carolina maintains an archive of NEXRAD products.  Here I used NCDCs Weather and Climate Toolkit to examine the storm total precipitation for the Solstice Flood.  The precipitation event started on June 19, 2012 at 05:41 GMT and ended on June 21, 2012 at 12:14 GMT with a maximum rainfall of 7.4 inches.  The conversion from Greenwich Mean Time to Central Daylight Time is – 5 hours (i.e. if the ending time is 12:14 GMT, then it would be 07:14 AM CDT).  The toolkit allows creation of animations of NEXRAD products, as well as export of shapefiles and Google Earth KMZ files.

Advanced Hydrologic Prediction Service – National Weather Service

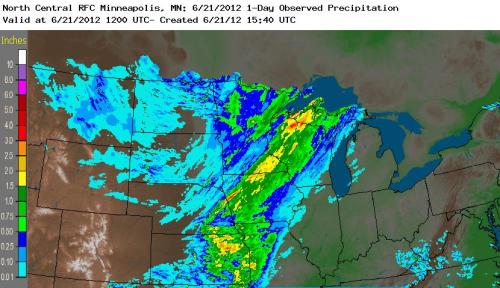
The Advanced Hydrologic Prediction Service (AHPS) provides information products to improve flood warnings and water resource forecasts. The Water page of the National Weather Service features several AHPS products including river observations, forecasts and precipitation.

The image below shows single day observed precipitation for June 20, 2012.  Note that 12:00 GMT is the start and end time of a standard hydrologic day used by AHPS in river modeling.  This runs from 07:00 AM CDT on June 20 to 07:00 AM on the following day.

Read Full Post »